
Indicative results of the electricity measuring campaign in the Municipality of Amaroussion (CRES)
Measuring is knowing!
Monitoring campaign
The monitoring campaign took place between 15 th of September and 15 th of December 2009, in a sample of 30 households in the Municipality of Marousi . The measuring equipment was installed in the main power supply boards of each household, allowing this way to measure the total electricity consumption of the household. Power measurements were taken using a time interval of 10 minutes. The overall measuring period for each household was 15 days. The measuring equipment that was installed measured both power demand and energy consumption. The measured data were transferred with the help of a modem from the measuring equipment to a data logger. In the end of every measuring period all the registered data in the logger were downloaded to a computer with the help of a program.
When the monitoring campaign was over the analysis of the data started, resulting to the creation of diagrams and power and energy consumption profiles for the sample.
The basic findings and results of the measurement analysis are presented in the following diagrams and tables.
Presentation of results
In diagram 1 the power demand profile for the average day of the sample is presented. As it can be seen the power demand is not steady throughout the day, presenting its lowest values during nighttime from 24:00 to 06:00, where it starts to increase reaching around 08:00 in the morning a peak value. This peak is related to the morning activities of the residents before they leave the house for their jobs. In the following hours the power demand presents a slight decrease and it is almost stabilized, until 14:00 – 15:00 when it increases again creating a second peak (this one is most probably related to cooking). The maximum power demand can be found during afternoon and evening hours until 23:00. During this period the power demand is notably higher compared to the rest of the day.
This daily power demand profile, with the maximum power consumption in the afternoon and evening hours, is typical for the average household, following the habits and obligations of the Greek modern family.
It should be mentioned here that the power profile described aboveis not representative for the entire year, since it refers to a season (autumn) where there was no need for cooling. The power profile referring to the period of a whole year, presents maximum values also around noon, due to the increased use of air-conditioning units during the summer period. Nevertheless, this power profile gives useful information for the periods where there is no need for cooling.
It is interesting to notice that during nighttime (from 24:00 to 06:00) there is a steady load of almost 250Watt. This load is most probably related to night lighting (internal and external), to equipment such as the refrigerators that operate 24hours a day or to appliances that are programmed to operate in the late evening hours due to cheaper cost of electricity (reduced nighttime invoice). Nevertheless a great share of this consumption is due to standby and off-mode loads from electronic and electrical equipments such as TVs, PCs, monitors, routers, etc.
The peaks found in the power demand profile are most probably due to loads related to cooking, hot water production, lighting and entertainment.
Diagram 1. Power demand profile for the average day of the sample.
In diagram 2 the power demand profile of a typical dwelling in the sample is presented.
The power demand profile of this household is similar to the profile of diagram 1, presenting increased demand for energy in the afternoon and morning hours and lower energy demand during the night (24:00 – 07:00).
![]()
Diagram 2. Power Demand profile of a typical household in the sample.
In diagram 3 the average weekly power cdemand of the sample is presented. As it can be seen from the diagram the trend of the power demand during weekdays follows the trend of the power consumption described in diagram 1. Specifically, the lowest values can be found during the night (24:00 till 06:00), then an increase from 07:00 to 10:00 follows. Afterwards the power decreases again until around 16:00, when it starts to steadily increase, presenting the maximum values around 21:00 – 22:00. The profile of power demand is similar for all weekdays, while there is a slight differentiation during the weekend. Especially on Saturday, there is an increase of power demand in the morning hours (09:00 – 14:00). The power demand during the afternoon and evening hours is similar to that of a weekday.
As noticed before, during nighttime (24:00 – 06:00) there is always a remaining steady power demand which can be explained by the same reasons mentioned above in the analysis of diagram1.
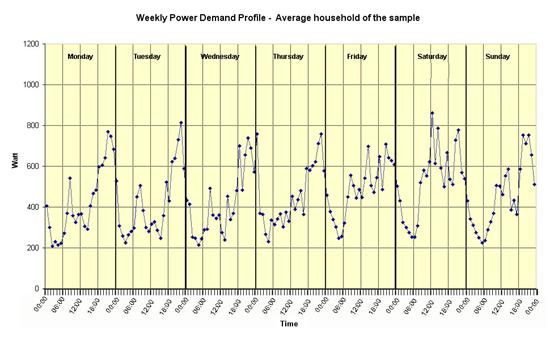
Diagram 3. Power demand profile for the average week of the sample.
In diagrams 4, 5, 6 and 7 the mean hourly power as well as the mean hourly power per resident and per surface is presented respectively. In Diagram 6 the hourly power consumption per resident and per surface are presented in a comparative way for each of the households in the sample.
Finally in Diagram 8 the mean daily energy consumption of each household is presented.
In all of the aforementioned diagrams the respective values for the average household of the sample are also given in a different coloring.
![]()
Diagram 4. Mean power demand for each household in the sample.
Diagram 5. Mean power demand per resident for each household in the sample.
Diagram 6. Mean power demand per surface for each household in the sample.
Diagram 7. Comparative diagram of the mean power demand per resident and per surface for each household in the sample.
Diagram 8. Mean daily energy consumption for each household in the sample.
Table 1 presents the average, minimum and maximum values of power and energy consumption of the sample of the 30 households, as well as information about the average residents per household and the average surface per household of the sample.
It should be mentioned here that trying to extrapolate the yearly values is a little bit risky, as the measuring period was very small (only two weeks) and it only represents one season of the year (autumn). Thus it does not include typical features of the power consumption of other seasons such as the summer period where we have increased power consumption for covering cooling needs, but also reduced power consumption for hot water production and lighting.
Table 2 gives a comparative overview of the results from this project and the results from previous surveys that CRES has conducted in the framework of former Intelligent Energy for Europe (IEE) projects (REMODECE , EURECO ) and also a comparison with the data from the National Statistical Service of Greece (ESYE) from 2004.
Looking at table 1 we can see deviations between the mean values and the min and max values. It is understandable that the power consumption differentiates a lot depending on several parameters such as the number of persons living in a household, the floor surface of the household, the way sanitary hot water is produced (e.g. solar thermal collectors or electrical water heater), the age of the residents (small children, elderly people) and on other parameters such as the energy efficiency of the household appliances, the level of ecological awareness of the residents etc.
The sample was categorized in households that use electrical water heaters for the production of hot sanitary water and in household that use solar thermal collectors, and the results of this categorization are presented in table 3. According to this table the mean hourly power consumption per resident for households that have an electrical water heater is 227 Watt / hour / resident, while the respective value for household that use a solar thermal collector and this way don't consume electricity for the production of hot sanitary water is 99 Watt / hour / resident. The sample of households is small, thus these values cannot be considered representative values, and the increased power consumption in the first category cannot be attributed totally to the use of the electrical water heater. Nevertheless these values are indicative of a trend that wants the households that use an electrical water heater to have higher electricity consumption, since the production of hot sanitary water is one of the most energy consuming activities of a household.
Finally it should be mentioned that in the case of large houses (two or three storey houses) it is becoming more and more popular to have an elevator inside the house. This fact of course increases significantly the power consumption of the household.
Table 1
|
Sample of 30 households
|
||
|
Mean value
|
Min value
|
Max value
|
Power per household ( Watt / household ) |
457
|
162 |
1.337 |
Power per resident (Watt/ resident ) |
18 8
|
63,6 |
334 |
Power per surface (Watt/m 2 ) |
4,06 |
1,19 |
9,62 |
Daily energy consumption (kWh/day) |
11,0 |
3,89 |
32,1 |
Mean yearly energy consumption ( kWh / year ) |
4.005 |
1.420 |
11.713 |
Yearly energy consumption per resident ( kWh / year / resident ) |
1.651 |
557 |
2.928 |
Yearly energy consumption per surface ( kWh / year / m 2 ) |
35,5 |
10,5 |
84,3 |
Residents per household |
2,7 |
1 |
5 |
Surface per household (m 2 ) |
111 |
60 |
170 |
Table 2
|
PEPESEC (2009) |
REMODECE (2006 – 2008) |
ESYE (2004) |
EURECO (2000 – 2002) |
Mean yearly energy consumption ( kWh / year ) |
4.005 |
4.035 |
4.658 3 |
|
Mean yearly energy consumption per resident ( kWh / year / resident ) |
1.651 |
1.165 |
1.517 |
1.704 |
Table 3.
|
Average value of households that use an electrical water heater |
Average value of households that use solar thermal collectors |
Power demand per resident (Watt/ resident ) |
227 ( max 295, min 166) |
99 (max 182, min 64) |
Finally in the framework of this project a saving potential was estimated by making the following assumptions: a) for appliances it was assumed that old appliances are replaced with new energy efficient ones, b) for lighting it was assumed that all CFL bulbs were replaced by CFL ones and c) for standby consumption it was assumed that the users had a change of behavior and all appliances are turned off by the on/off button, so there are no standby consumption losses.
Table 4.
|
PEPESEC (2009) |
REMODECE (2006 – 2008) |
EURECO (2000 – 2002) |
Mean yearly energy consumption of a household ( kWh / year ) |
1.001 |
1.092 |
1.074 |
According to the aforementioned assumptions the mean yearly energy saving per household is estimated to be 1.001kWh / year / household as it can be seen in table 4. The respective value as estimated from the REMODECE project is 1092kWh / year / household , and 1.074 kWh / year / household according to the EURECO project .
It is should be mentioned here that the saving potential increases significantly if a solar thermal collector is installed for covering the needs for hot sanitary water production., especially in a country like Greece, with a very good coverage from the sun throughout the year. The saving potential if a typical solar thermal collector is installed in a household is estimated to be around 1.000kWh/year/household. This number is very close to the amount of energy saved when the aforementioned interventions are done.
Conclusions
The residential sector plays an important role in the reduction of green house gas emissions, given that energy consumption in this sector accounts almost to 25% of the total final energy consumption of Greece and there lies an important saving potential.
In the framework of this project data concerning the electricity consumption of households were collected for the first time in the Municipality of Marousi .
According to these measurements the mean yearly electricity consumption of a household was calculated to be 4.005 kWh / year / household and the mean yearly electricity consumption per resident was 1.651 kWh / year / resident. The main conclusions of the data analysis are summarized below.
During nighttime (from 24:00 to 06:00), although there is no human activity, there is a steady load of almost 250Watt/hour. This load is most probably related to night lighting (internal and external), to equipment such as the refrigerators that operate 24hours a day or to appliances that are programmed to operate in the late evening hours due to cheaper cost of electricity (reduced nighttime invoice). Nevertheless a great share of this consumption is due to standby and off-mode loads from electronic and electrical equipments such as TVs, PCs, monitors, routers, etc.
The average hourly power consumption per resident is higher for households that use an electrical water heater for producing hot sanitary water compared to the one for houses with solar thermal collectors. The sample of households is small, thus these values cannot be considered representative values, and the increased power consumption in the first category cannot be attributed totally to the use of the electrical water heater. Nevertheless these values are indicative of a trend that wants the households that use an electrical water heater to have higher electricity consumption, since the production of hot sanitary water is one of the most energy consuming activities of a household.
Finally the mean yearly energy saving per household is estimated to be 1.001kWh / year / household. This saving potential accounts almost to 25% of the yearly electricity consumption of a household and it was estimated based on the following assumptions:
a) for appliances it was assumed that old appliances are replaced with new energy efficient ones, b) for lighting it was assumed that all CFL bulbs were replaced by CFL ones and c) for standby consumption it was assumed that the users had a change of behavior and all appliances are turned off by the on/off button, so there are no standby consumption losses.
This saving potential can be increased by almost 1.000 kWh/ year / household, if a solar thermal collector is installed for the production of hot sanitary water.
Concluding, it should be stated that there is a very important saving potential in the residential sector and it can be up to 50% by making interventions such as use of energy efficient appliances and solar thermal collectors and also with the change of behavior of consumers.
REMODECE – Residential monitoring to decrease energy use and carbon emissions in Europe, project of the program Intelligent Energy for Europe (I Ε E 05-124)
EURECO - End use metering campaign in 400 households of the European Community, project of the program SAVE 267/98
The results from both these projects refer to a sample of 100 households .
.
![]()